Showing posts with label Bonddad. Show all posts

Tuesday, April 24, 2007

Dollar Still Falling, Nears All-Time Lows: Bonddad

April 24, 2007

By Bonddad
bonddad@prodigey.net

From Investor's Business Daily (subscription only):

The dollar last week sank to a 26-year low against the British pound and is nearing record lows vs. the euro. Even the lowly Japanese yen has gained some ground against the greenback.

Analysts say the dollar's fall is the result of a cyclical shift in the global economy: Growth and interest rates in Europe and Asia are outpacing those in America, drawing capital away from U.S. stocks, bonds and other assets.

"There are reasons to be bullish about other currencies, and that's why people are moving out of the U.S. dollar," said David Watt, senior foreign exchange strategist at RBC Capital Markets.

There are numerous reasons for the dollars decline.

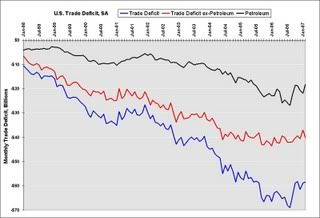
1.) While the trade deficit appears to be moderating, it is still at high levels. Here is a chart from the Blog Calculated Risk. The lowest line is the overall trade deficit. The middle line represents oil imports and the top line represents oil imports only. Currency traders are selling the dollar partly because the US consumes more than it makes (which the trade deficit represents).

Photo Sharing and Video Hosting at Photobucket

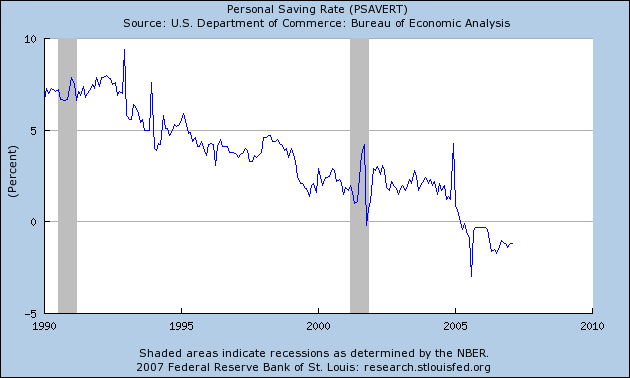
2.) The US savings rate is still negative, indicating the trade deficit must be financed from abroad. So long as the US economy has to have international financing to pay its bills, traders will lose confidence in the dollar.

Photo Sharing and Video Hosting at Photobucket

To finance the trade deficit, the US and its trading partners are engaged in an "economic merry-go-round:"

But another baby step of a 27-basis-point rate increase will do little to cool the steamy Chinese economy or markets. To prevent a faster rise in its currency, the Chinese monetary authorities had to buy a staggering $136 billion in the first quarter alone, bringing China's foreign-exchange reserves to $1.2 trillion.

To buy up greenbacks, the PBOC "prints" yuan, colloquially speaking. The dollars are invested primarily in Treasuries and U.S. agency securities, with the salubrious effect of financing the U.S. budget and current-account deficits, in turn bolstering the dollar and holding down U.S. interest rates.

That this dollar merry-go-round cannot go on forever is at the core of the dollar bears' argument. The massive U.S. current-account deficit has to be funded, either through these political contrivances or capital inflows.

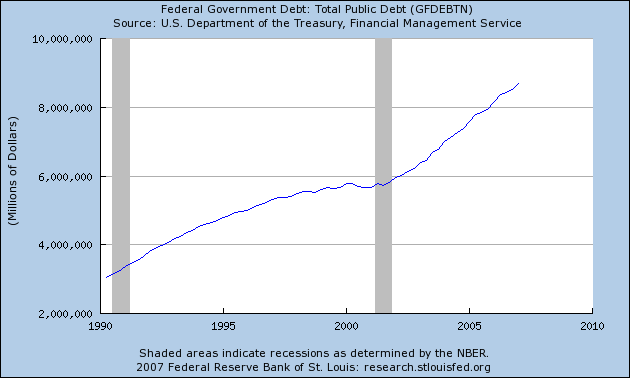
3.) The US Federal Deficit is far from "under control". The figures reported in the press (and by the Bush administration) include the Social Security surplus. Unfortunately, the US government is spending this money now instead of actually saving it (even US politicians have no idea how to save). This means the US will eventually have to pay all this debt back, which means we will have fiscal problems going forward.

Photo Sharing and Video Hosting at Photobucket

4.) Other countries rate of growth is increasing. According to the International Monetary Funds World Economic Outlook, the rest of the world's growth is doing pretty well. That means other currencies are more attractive.

5.) While US interest rates are still some of the best around, other countries/regions are starting to raise their rates for various reasons. As the IBD article noted:

The European Central Bank and policymakers in China and Japan also are leaning toward rate hikes amid relatively robust growth and expectations of higher inflation.

Meanwhile, the Federal Reserve is likely to stay on hold for the foreseeable future. Policymakers are betting that subpar growth will cool inflation, which is still above the Fed's 1%-2% comfort zone.

The EU has raised rates over the last year or so, and Japan actually has interest rates above 0% (they stand at .5% now). While Japan still has a long way to go before they reach parity with the US, their announcement a few months ago to raise interest rates sent a shock through the financial markets as it signaled the carry-trade (borrowing in Japan and lending anywhere else) was no longer a given (the chart is from Barron's).

Photo Sharing and Video Hosting at Photobucket

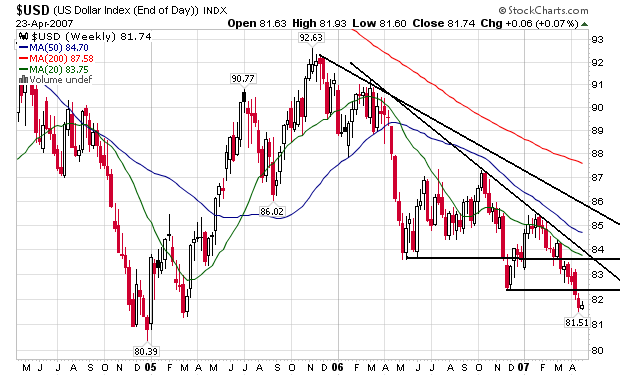
6.) The actual chart of the dollar has nothing but bearish implications. Note the following:

-- The overall trend is clearly down

-- The 20, 50 and 200 day simple moving averages are all heading lower

-- The overall index is trading below the moving averages, meaning price action will continue to pull the moving averages lower.

Photo Sharing and Video Hosting at Photobucket

The conclusion from all this? There is no news that is dollar bullish and plenty of news that is dollar bearish.

For economic commentary and analysis, go to the Bonddad blog

Wednesday, April 11, 2007

Home Foreclosures Increasing Above 2001 Recession Levels

April 11, 2007

By Bonddad
bonddad@prodigey.net

And here's more:

The percentage of mortgages in default rose to 2.87%, surpassing the worst levels following the 2001 recession.

"The news is unremittingly bad," CNBC's Steve Liesman said Tuesday. "Delinquency rates were up in 44 of the 50 states."

The only states where delinquencies didn’t increase were Kansas, Kentucky, Montana, North Dakota, South Carolina and Utah.

The states with the highest delinquency rates are:

Mississippi, 4.85%
Texas, 4.09%
Michigan, 4.06%
Georgia, 3.89%
West Virginia, 3.83%

Let's put that picture in perspective.

In 2001 we were in a recession. According to the National Bureau of Economic Research the US economy was in a recession from March to November 2001. Rising foreclosures are a natural consequence of a recession. However, now we are in an expansion, albeit it a slower one. To hit record foreclosures in an expansion indicates there is a big problem somewhere.

Also consider these jumps in large cities foreclosure rates:

During the first quarter, foreclosures have jumped sharply across the nation’s top urban markets, according to a PropertyShark.com report released to CNBC.

In Miami, foreclosures are up nearly 31%, in Los Angeles 24%, and in New York City, up 56%, the website said. Properties in the borough of Queens accounted for the bulk of the New York foreclosures, jumping 91% alone.

Miami experienced the highest quarterly foreclosure rate per household. In Miami-Dade County, there were 987 residential auctions in the first quarter, which translates into 127 foreclosures per 1,000 households. Miami typically has foreclosure rates higher than the national average because it attracts investors that buy into properties before they’re developed with hopes of flipping them later at a profit.

Let's add some more statistics that indicate these problems are occurring an an economically significant time.

According to the BLS unemployment is at 4.4%. That should mean people have plenty of money. And in fact according to the BEA national disposable income actually rose last year, indicating people do have a bit more money.

So what's the problem? Here it is in a nutshell:

Photo Sharing and Video Hosting at Photobucket

Over the last 5 years, the percentage of higher risk loans underwriting on a yearly basis has been increasing. Simply put, it looks as though some of those loans were poorly underwritten -- at best.

There is no way to simply erase all of these loans. We have to let the market run it's course. That means this problem is going to be with us for some time.

For economic commentary and analysis, go to the Bonddad Blog

Tuesday, March 27, 2007

Housing Bottom? Not After Yesterday's News

Mar 27, 2007

By Bonddad
Bonddad@prodigy.net

Below is a compilation of posts I made on my blog about yesterday's new home sales numbers.

There is no way to spin these numbers as anything but terrible. Worst of all, they don't reflect the complete loss of subprime borrowing which will probably send these numbers lower in future months.

Here's the short version: sales dropped and inventory increased. And it's only going to get worse.

First -- this report has an incredibly large confidence interval. That simply means the actual number could be plus or minus 17.4.

The information is from the Census Bureau

Sales are down 18.3% from February of last year.

There is now an 8.1 month supply of available inventory. That's a ton of homes.

The total raw inventory level has increased from 538,000 in February 2006 to 546,000 in February 2007. Remember we saw housing starts increase 9% in February. That means we've got more inventory coming onto the market. My guess is the homebuilders were expecting demand to pick-up a bit this year. These recent starts could mean the market may build an unwanted inventory glut.

The Northest and Midwest saw big drops -- 27% and 20%, respectively. The weather will be blamed for some of this. The West saw a 24.6% increase. That number doesn't make sense. I am guessing we'll see a revision of that number or the January number sometime soon.

Also remember that lending standards have tightened over the last few months. That means there will be fewer buyers going forward.

Also -- the median price increased from 243,200 to 250,000. It doesn't make sense for prices to increase in a decreasing sales market.

From Bloomberg:

The supply of unsold homes climbed to the highest in 16 years, the Commerce Department said in Washington today. Purchases dropped 3.9 percent to an annual pace of 848,000 last month. Economists had forecast they would rise to a 985,000 rate, based on the median forecast in a Bloomberg News survey.

.....

``As ugly as these numbers are, they don't reflect the tightening of lending standards, which means sales are going to get worse,'' said Christopher Low, chief economist at FTN Financial in New York. ``The longer it takes for housing to recover, the more the risk it could spill over to other parts of the economy.''

From CBS:

Inventories of unsold homes rose 1.5% to 546,000, representing an 8.1-month supply, the largest inventory in relation to sales since January 1991, at the tail end of a recession. The inventory is up 27% in the past 12 months.

Inventories are probably understated, however, because they don't include homes thrown back on the market due to buyer cancellations

Record backlogs

The number of completed but unsold homes rose to a record 179,000 in February from 177,000, up 43% from a year earlier.

"There is an enormous backlog of unsold new homes that have to be worked off before builders will start building spec homes," wrote Ray Stone, chief economist for Stone & McCarthy Research, in a research note.

Let's review the points made above.

1.) Sales are at the lowest level in 7 years

2.) Inventories are the highest they've been in 16 years -- at the tale end of a recession.

3.) Inventories are probably higher because of cancellations.

4.) Tighter lending standards -- which have been recently implemented -- aren't included in these numbers.,

5.) The number of completed and unsold homes is at a record.

None of this news points to a bottom in housing. We're not even close.

This graph is from Interest rate roundup a great blog that everybody should read. Not only does it make me miss a Bloomberg terminal, it also shows just how out-of-whack the current inventory level is with historical norms.

I resized the chart. It goes back to 1963.

Photo Sharing and Video Hosting at Photobucket

There's only one way to sell this inventory in a tightening credit market -- lower prices.

There's one final chart that is really important. It's from the blog Calculated Risk -- another great blog everyone should read. It shows the relationship between new home sales and recessions. Notice one thing in this chart: The US economy has never had a drop in new home sales of this magnitude without having a recession. That does not mean we will have a recession, just that these two events are pretty strongly correlated.

Photo Sharing and Video Hosting at Photobucket

As I mentioned at the beginning, these numbers are uniformly awful. And worst of all, we're seeing housing credit dry up.

We're nowhere near a bottom yet.

Friday, March 23, 2007

The Coming Mortgage Metldown

Mar 23, 2007

By Bonddad
bonddad@prodigy.net

The housing market led to the massive increase in subprime loans over the last three or so years. Underwriting standards were continually relaxed until only a pulse was required to get a loan. Now the proverbial chickens have come home to roost. 44 lenders have now either closed their doors, declared bankruptcy or sold off their assets. And in all probability it will get much worse.

The excerpts are from a WSJ (sub. required) editorial titled Mortgage Meltdown.

The primary argument advanced by housing bulls right now is the damage of subprime mortgages will be contained. However, consider these numbers:

Far from being limited to the subprime market, the data show these risky loan features have become widespread. According to Credit Suisse, the number of no or low documentation loans -- so-called "liar loans" -- has increased to 49% last year from 18% of purchase loans in 2001, a nearly three-fold increase. The investment bank also found that borrowers put up less than a 5% down payment in 46% of all home purchases last year. Inside Mortgage Finance estimates that nontraditional mortgages -- mostly interest-only and pay-option ARMs that allow the borrower to defer paying back principal or even increase the loan balance each month -- which barely existed five years ago, grew to close to a third of all mortgages last year.

The Alt-A market, a middle ground between subprime and prime, has increased seven-fold since 2001 and accounted for 20% of home-purchase loans last year. Fully 81% of Alt-A loans last year were no or low documentation loans, according to First American Loan Performance. Why have borrowers employed this kind of risky financing? Because it was the only way many of them could afford a home in some of the hottest housing markets, where prices more than doubled in five years.

Let's break these numbers down.

According to Credit Suisse, the number of no or low documentation loans -- so-called "liar loans" -- has increased to 49% last year from 18% of purchase loans in 2001, a nearly three-fold increase

This is a poorly written sentence. I am assuming he means that nearly half of all subprime loans were "liar loans". This would make sense as credit standards have continually deteriorated over the last few years.

borrowers put up less than a 5% down payment in 46% of all home purchases last year.

This has a few very negative implications.

1.) Americans aren't saving. Period.

2.) There is little home equity, which would help to cushion the effects of dropping prices. This prevents homeowners from refinancing mortgages.

3.) Lending standards have really deteriorated.

Nontraditional mortgages .. increased to a third of all mortgages last year.

That means there are a ton of highly questionable loans on the market. This is probably one reason why the number of delinquencies has increased so dramatically over the last year.

The Alt-A market, a middle ground between subprime and prime, has increased seven-fold since 2001 and accounted for 20% of home-purchase loans last year. Fully 81% of Alt-A loans last year were no or low documentation loans,

An overwhelming majority of the middle tier of mortgage risk has no documentation. That means for practical purposes, these are subprime loans.

Here's where the real problem is going to come in.

It's not the size of foreclosure losses as a share of the economy that matters, it is the effect those losses have on the availability of credit. When banks (and investors in mortgage-backed securities) begin suffering losses, they inevitably pull back. This is why so many subprime companies have gone bankrupt virtually overnight; investors balked at buying subprime loans except at a steep discount, which produced immediate losses. In effect, their ability to profitably finance new loans was eliminated.

What's more, the bank regulators are only now beginning to tighten lending standards and will be under increasing pressure from Congress to do more. After growing by nearly 50% in the first half of 2006, nontraditional loan growth has turned negative since the bank regulators issued new guidelines last September. The CFO of Countrywide recently told an investor conference that 60% of the subprime loans the company is making won't meet proposed federal rules likely to take effect during the summer. The concern that tighter lending standards could reduce access to financing is the reason a widely watched survey of homebuilders conducted by the National Association of Homebuilders dropped earlier this week.

First, Countrywide is one of the largest mortgage lenders in the country. And over half of the loans they are currently making won't be made when new lending standards take effect. That means there will be a severe credit contraction, which is never a good thing.

The ride is going to get bumpier.

For economic analysis and commentary, go to the Bonddad Blog