By Bonddad
Bonddad@prodigy.net
Below is a compilation of posts I made on my blog about yesterday's new home sales numbers.
There is no way to spin these numbers as anything but terrible. Worst of all, they don't reflect the complete loss of subprime borrowing which will probably send these numbers lower in future months.
Here's the short version: sales dropped and inventory increased. And it's only going to get worse.
First -- this report has an incredibly large confidence interval. That simply means the actual number could be plus or minus 17.4.
The information is from the Census Bureau
Sales are down 18.3% from February of last year.
There is now an 8.1 month supply of available inventory. That's a ton of homes.
The total raw inventory level has increased from 538,000 in February 2006 to 546,000 in February 2007. Remember we saw housing starts increase 9% in February. That means we've got more inventory coming onto the market. My guess is the homebuilders were expecting demand to pick-up a bit this year. These recent starts could mean the market may build an unwanted inventory glut.
The Northest and Midwest saw big drops -- 27% and 20%, respectively. The weather will be blamed for some of this. The West saw a 24.6% increase. That number doesn't make sense. I am guessing we'll see a revision of that number or the January number sometime soon.
Also remember that lending standards have tightened over the last few months. That means there will be fewer buyers going forward.
Also -- the median price increased from 243,200 to 250,000. It doesn't make sense for prices to increase in a decreasing sales market.
The supply of unsold homes climbed to the highest in 16 years, the Commerce Department said in Washington today. Purchases dropped 3.9 percent to an annual pace of 848,000 last month. Economists had forecast they would rise to a 985,000 rate, based on the median forecast in a Bloomberg News survey.
.....
``As ugly as these numbers are, they don't reflect the tightening of lending standards, which means sales are going to get worse,'' said Christopher Low, chief economist at FTN Financial in New York. ``The longer it takes for housing to recover, the more the risk it could spill over to other parts of the economy.''
Inventories of unsold homes rose 1.5% to 546,000, representing an 8.1-month supply, the largest inventory in relation to sales since January 1991, at the tail end of a recession. The inventory is up 27% in the past 12 months.
Inventories are probably understated, however, because they don't include homes thrown back on the market due to buyer cancellations
Record backlogs
The number of completed but unsold homes rose to a record 179,000 in February from 177,000, up 43% from a year earlier.
"There is an enormous backlog of unsold new homes that have to be worked off before builders will start building spec homes," wrote Ray Stone, chief economist for Stone & McCarthy Research, in a research note.
Let's review the points made above.
1.) Sales are at the lowest level in 7 years
2.) Inventories are the highest they've been in 16 years -- at the tale end of a recession.
3.) Inventories are probably higher because of cancellations.
4.) Tighter lending standards -- which have been recently implemented -- aren't included in these numbers.,
5.) The number of completed and unsold homes is at a record.
None of this news points to a bottom in housing. We're not even close.
This graph is from Interest rate roundup a great blog that everybody should read. Not only does it make me miss a Bloomberg terminal, it also shows just how out-of-whack the current inventory level is with historical norms.
I resized the chart. It goes back to 1963.
There's only one way to sell this inventory in a tightening credit market -- lower prices.
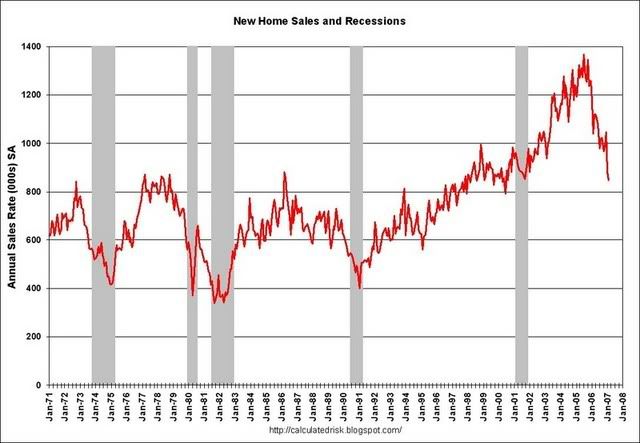
There's one final chart that is really important. It's from the blog Calculated Risk -- another great blog everyone should read. It shows the relationship between new home sales and recessions. Notice one thing in this chart: The US economy has never had a drop in new home sales of this magnitude without having a recession. That does not mean we will have a recession, just that these two events are pretty strongly correlated.
As I mentioned at the beginning, these numbers are uniformly awful. And worst of all, we're seeing housing credit dry up.
We're nowhere near a bottom yet.
No comments:
Post a Comment